Monday, September 30, 2019

When Teams Should Go For It

I updated my work regarding when teams should go for it. This time around, I included how many yards are needed for a first down. The only thing I did not consider was score differential, which obviously has an effect on whether or not it is smart to go for it on 4th down. I wanted to make a visual that was easy to digest and including score differential would create a plot that would be a bit overwhelming to to comprehend. I hope this visual can provide fans with a quick, general insight into whether or not it is smart for a team to go for it on fourth down depending on where their team is on the field. The data is from the 2017, 2018, and 2019 seasons.  Again, without considering score differential the following plot should provide a tool that, in general, can help you decide whether or not your team is making an optimal decision:


The following table shows how teams made decisions on 4th down, sorted by their win probability efficiency. The column n refers to the number of 4th downs faced by each team from the 2017 season through week 4 of 2019. WPA is the total sum of win probability added. WPA_rate refers to the average win probability added per 4th down decision:


Team n WPA WPA_rate
NO 251 6.211646 0.0247476
CAR 249 5.826511 0.0233996
PHI 290 6.708923 0.0231342
JAX 318 7.274348 0.0228753
SEA 284 6.472430 0.0227902
TEN 285 6.127234 0.0214991
KC 241 5.105903 0.0211863
BAL 292 6.133023 0.0210035
CLE 284 5.949736 0.0209498
DAL 263 5.346181 0.0203277
SF 255 4.745451 0.0186096
IND 262 4.816956 0.0183853
WAS 279 4.919168 0.0176314
LAR 272 4.680137 0.0172064
OAK 254 4.367662 0.0171955
HOU 286 4.852588 0.0169671
CIN 257 4.328201 0.0168412
NYJ 303 5.070392 0.0167340
PIT 233 3.819015 0.0163906
GB 269 4.159784 0.0154639
DEN 288 4.442432 0.0154251
ATL 251 3.806670 0.0151660
BUF 291 4.136138 0.0142135
MIA 285 4.003178 0.0140462
NE 287 3.823110 0.0133209
DET 270 3.572651 0.0132320
TB 227 2.945880 0.0129774
NYG 290 3.541315 0.0122114
CHI 276 3.361816 0.0121805
ARI 303 3.518561 0.0116124
LAC 248 2.799185 0.0112870
MIN 272 2.878713 0.0105835

data via nflscrapr


Taking Stock of Teams a Quarter of the Way Through the Season

We are now, almost, one quarter of the way through the season (this post is being written before the Monday night game between the Steelers and Bengals). I figured it would be a good time to take stock of some of the most prolific and lousy offenses around the league in two distinct situations: 1st down and second and long (defined as greater than five yards to the first down marker) and 3rd and long. These situations are vital to the overall success of an offense. Running plays on third and short or forgoing 3rd down together leads to productive drives. Offenses that find themselves calling plays facing a 3rd and long consistently will find it difficult to string together enough plays to put points on the board. Furthermore, these plays yield low success rates (to the tune of 33.67% in 2019). Granted, good offensive teams should generally perform better on these plays. However teams that have been more efficient on these plays than those on early downs (success rate on early downs with over 5 yards to go is about 40%) should expect their offenses to regress as the season goes along. So, lets take a look at the data (as always I filtered out garbage time where the offensive team has a win probability of greater than 85% and less than 15%):


Kansas City has been far and away the most successful offense on early downs and more than yards to go. Not only are the Chiefs the most successful, but they have been throwing at a rate of 76.3%, by far the most in the league thus far. Under the tutelage of first-time head coach Zac Taylor, the Bengals (pending Monday night) have thrown at a rate of 70.5% albeit with much less success than their counterparts in Kansas City. However, given Taylor's reputation as a budding offensive coach having breathed the same air as Sean McVay for the past two seasons, this is a positive development. It is also worth mentioning that, like in most other situations, the Cardinals and Bills are also throwing the ball at some of the highest rates in the league. Even after Buffalo's putrid performance against the Patriots, the Bills still have been one of the best teams on these early down plays. Unsurprisingly given their expectations to start the year and their early schedules , the Cowboys, Ravens, and Chargers have all been among the best on early downs and long thus far. What is surprising, however, is the fact that the Raiders and Dolphins have been similarly as good. Given that the Dolphins are regarded as the worst team in the league and the Raiders are often cited as one of the worst, I was shocked to see how well they have played in this pivotal split. Given their offensive talent, I would expect both to negatively regress a bit as their non-garbage time sample grows, but even then we should be expecting some positive offensive regression overall if they can continue to perform even moderately effectively. 

On the flip side, it would not be a honest discussion of the league's offensive landscape without mentioning the brutal incompetency of the Jets. They have by far the lowest success rate on these early down plays and one of the lowest pass rates. Call it a Gase special. The Falcons despite employing Matt Ryan and Julio Jones, have also lagged behind the rest of the league in this metric. The Falcons have had a rough start to the year, but given their personnel this figure should improve. Nevertheless even modest improvement will not get them into the upper half of the league. This may be a lost season for Ryan and co. and the last season with Dan Quinn at the helm in Atlanta. Jay Gruden's tenure in Washington looks to be on a similar collision course with fate as Quinn's in Atlanta. Washington does not boast the same firepower as Atlanta, but the recent comments and rumors surrounding Gruden and the selection of Dwayne Haskins hint that Gruden and the front office are not on the same page.

The Vikings, despite two great offensive showings against Atlanta and Oakland, have been one of the worst teams on early downs. Their lack of success can be attributed to their putrid performances against Green Bay and Chicago. They continue to run the ball at one of the highest rates in the league in all situations. When they jump out to early leads, this is not much of an issue but against more stout units like those of their division rivals, they have put up putrid performances. Given that their early leads against Atlanta and Oakland led to a lot of garbage time, it is no surprise that their performances against the Packers and Bears are weighing their numbers down. San Francisco, who was on a bye this week, has gotten off to a hot start. They have not done a great job taking care of the ball, but on a per-play basis have been one of the best offenses in the league. With that being said, the Niners performance on early downs is a bit concerning. If they continue this level of efficiency on 1st and 2nd and long, I would expect some heavy negative regression to visit the Bay Area. 

Now, looking at third and long success rates, what are some offenses due for regression?


Miami loses all its aforementioned advantages on early downs on third and long. Much of their offensive woes can be attributed to not being able to extend drives. Miami is posting a 12.5% success rate and is, on average, losing more than one expected point per play on third and long! Amazing. The Ravens also have been dreadful on third and long; they have been merely bad based on EPA per play, but their 14.5% success rate is almost Dolphins-esque. Given Baltimore's productiveness on early downs, I would expect its offense to see some positive regression and remain among the top ten units in the league. 

The Jets have been the worst offense on early downs and one of the worst on third and long...yikes. Washington has been very successful on third and long but only better than the Jets early in their series'. Given how they looked yesterday against the Giants, I would expect things to only get worse. Both the Vikings and Niners, whose offensive ineptitude on early downs screamed regression, are hanging their hats on third and long. Another reason to expect both of these offenses to decline in effectiveness as the season goes along. Finally, Dallas shows up again as one of the best in this split. The Cowboys early down success indicates that this offense is for real, but I would expect them to slow down a bit as their schedule gets more difficult and they regress on third and long. 

Tuesday, September 24, 2019

Week 3 Play Script Signals

Now that all 32 teams have played three games, our sample of every team's play script signalling is becoming more meaningful. As I said in the first post about play script signals, looking at how teams script their first handful of plays can give us insight into how each coaching staff views its optimal run-pass split. The beginning of the game always offers neutral game scripts because the score always starts at 0-0. So, after three weeks, I looked at the first 15 plays for each team over the course of three game, giving us a sample of 45 plays to look at. I then calculated the EPA per play  and the team's passing rate on those 45 plays and plotted the relationship to get a visual on how teams are approaching run-pass splits to start and their general effectiveness on those scripted plays:

Kansas City and Buffalo stand alone in regards to their passing rates, posting rates of 80% and 77.7% compared to their non-garbage time rates of 72.4% and 69% respectively. Considering these teams are both 3-0, it should not be surprising that their pass rates fall as the game goes on. Teams that are winning run the ball more. Kansas City has been much more effective than Buffalo on scripted plays, generating on average about .43 EPA per play to Buffalo's lowly -.17. These figures place Kansas City as the third most lethal offense in the league thus far on scripted plays and Buffalo 26th. With that being said, its hard to not be encouraged how aggressive Buffalo is putting the ball through the air. I talked early about the Bills' commitment to building an analytics staff this off-season and the team's decisions so far indicate that the coaching staff is listening to it.

Green Bay has been the fourth most efficient team on scripted plays and boast the third most passes through three games on these plays. The Packers pass rate dips to about 64% overall when filtering out garbage time, but we have seen Green Bay play way more conservatively after building leads against Minnesota and Denver the past couple of games. Arizona is actually throwing at a lesser rate for their scripted plays compared to the rest of the competitive portion of the game. On scripted plays they are throwing on 2 out of every 3 plays, while that figure creeps up to a league-leading 75.5% for non-garbage time plays. This makes some intuitive sense; the scripted pass rate indicates Arizona wants to throw the ball a ton and since they have been playing from behind for much of this season, that rate should be expected to increase.

Looking at some of the other 3-0 teams around the league, the Patriots have around a league average pass rate on these scripted plays but have been the second best according EPA, which, when accounting for the Patriots early schedule (blow outs of the Steelers, Dolphins, and Jets) should not be surprising. Dallas, hiding behind the Redskins logo, is clustered around the majority of the league in both pass rate and EPA per play. This offenses first real test of the season will come Sunday night against the Saints.

The Vikings have been the fifth best team on these scripted plays (.266 EPA per play) while passing at a minuscule rate of 48.9%, the least frequent in the league. Those who espouse the merits of pounding the rock might cite this as evidence that Minnesota's off-season commitment to running the ball is paying dividends. I would respond with saying that even though this 45 play sample is useful for looking at team's play calling tendencies, its still too small of a sample to draw conclusions regarding offensive effectiveness. If the Vikings keep running the ball at this rate to open up games, I would expect some regression.

The Eagles are known to the public as being on the forefront of NFL analysis, yet they are passing the ball on just 51% of their plays to open up games, the second smallest rate to the aforementioned Vikings, with middling results. Much has been made of the dropped passes by Nelson Agholor and the injuries to Alshon Jeffrey and DeSean Jackson, but the Eagles cannot afford to start games off slow after their 1-2 record through three games. Philadelphia is at its most potent when Carson Wentz is making plays; being conservative at the beginning of the their upcoming game against a good Packers defense could be costly in such a pivotal game.

The Ravens have thrown the ball on the 4th fewest instances but have added a league-leading .63 EPA per play on scripted plays, almost 20% better than the second-best figure of the Patriots. I would be shocked if there is not a good deal of regression in this department; thus far they have played a weak set of defenses in Miami, Arizona, and Kansas City.

Finally, I wanted to point out the outrageous ineptitude of the Jets and Seahawks. The Jets are passing the ball 53.3% of the time with an EPA per play of -.41. This level of conservatism and lack of offensive firepower has been characteristic of non Peyton Manning led Adam Gase offenses. Its going to be a long year for gang green. The Seahawks have the fourth-lowest EPA per play and 7th lowest pass rate. Seattle has one of the best quarterbacks in the entire league yet insist on handing the ball off almost 50% of the time on both scripted plays and non-garbage time plays overall. Its no wonder Russell Wilson seems to be always bringing Seattle back from a multi-score deficit the last couple of seasons. One can only wonder how good this Seattle offense could be if their coaching staff was not calling plays like the Vince Lombardi led Green Bay Packers.


Sunday, September 22, 2019

The Debut of Daniel Jones

As all followers of the NFL knew, today was the debut of controversial first round pick Daniel Jones. Much of the NFL analytics community (including myself) criticized Giants general manager Dave Gettleman for choosing a quarterback of his statistical record with the 6th overall pick. He was quoted as saying "After the three series I watched, I saw a professional quarterback. So that's when I was in full-blown love." Needless to say this quote did not go over well. However, with Daniel Jones having made his first start, we can now actually begin to analyze what will undoubtedly be the most important move of the Gettleman era in New York. We saw Jones play well in the preseason, but that was mostly against backups. Now, we can finally see what he looks like against real NFL defenses.

The Giants were trailing for most of the game, so the fact that they were so willing to throw the ball should not be too much of a surprise. With that being said, I was surprised with how aggressive they were even on early downs. On 25 first down plays, Daniel Jones threw the ball 68 percent of the time. On 21 second down plays, he threw about 62 percent of the time. And on 14 third down plays, he threw the ball every time. Success rate is defined as the percent of plays that yielded a positive expected points added value. So we can look at these throws by down by their rate of success. These passes led to a 32 percent success rate on first down, 33 percent on second down, and 50 percent on third down. The early down success rates were a bit lower than one would like to see (for reference, the overall success rate for all run and pass plays is about 43 percent). What was so impressive about Jones' work on third down is his throws yielded a 50 percent success rate, but due to the Giants struggles on early downs, he was facing on average 7.57 yards to go on third down. Now, we are talking about 14 plays so we should not jump to any meaningful conclusions. But, it is better to succeed in these situations then to flounder. This is not to say he is going to maintain this level of efficiency for the rest of the season or the rest of his career, but this was definitely a nice way to start his career.

One of the positives for Jones coming into the league was his athletic profile. He was able to show off his considerable athletic gifts in the combine and this aspect of his game should offer some level of excitement for Giants fans after watching the immobile Eli Manning for the last decade and a half. Jones scrambled 3 times in this game with two of those scrambles ending in a success. These scrambled averaged 2.13 expected points added including the game winning touchdown, so they proved to be pivotal in the outcome of the game. Again, I cannot stress enough that we are dealing with tiny samples here but we know that quarterback scrambles tend to be high value plays. If Jones can parley his athletic gifts into generating high EPA plays with his legs, this gives him some margin for error as a passer.

Finally, I wanted to look at how far down the field he was throwing the ball in each direction of the field. The following plot shows his distribution of air yards, defined as the distance the ball flies down the field with respect to the line of scrimmage, for throws to the left, right, and middle of the field:

Besides a few deep throws, most of his throws to the right were targeted between 0 and 10 yards down the field. His throws to the middle were more at the intermediary depths of 10 to 19 yards down field. And his throws to the left were pretty evenly distributed to all areas of the field. Overall he was willing to let the ball fly a bit, a departure from the dink and dunk passes that seemed to define the Giants offense the last few seasons.

Overall, this was an encouraging debut. As a Daniel Jones skeptic going into the year, I am not ready to call him the savior of the franchise. We are talking about 1 regular season game, so it is important to not overreact. However, if this game is any indication of what type of player he is going to be as a pro, Giants fans should be excited about what Jones is capable of not just this season, but for the remainder of his tenure. in New York.

Saturday, September 21, 2019

Offensive Holding Through Week 2 of 2019

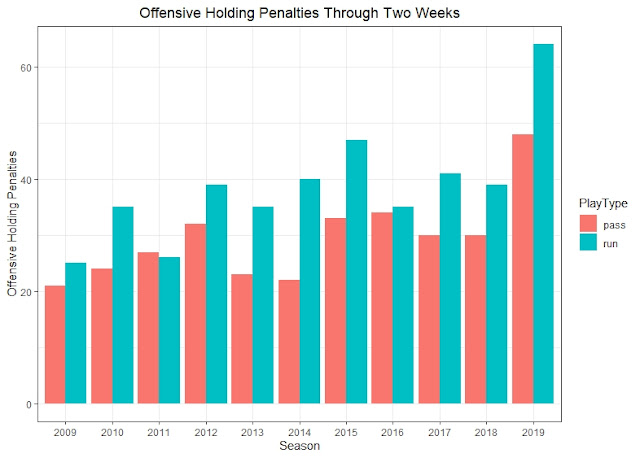
One of the big off-season story lines regarding officiating was the emphasis on calling offensive holding penalties. One area that the referees sought to pay more attention was holding on the backside of running plays. With that being said, it is natural to wonder if the referees were going to follow through with this plan. We know that the NFL has instituted rule changes in the past few seasons to maintain elevated levels of scoring. Such initiatives included more strict enforcement of roughing the passer and defensive pass interference. So, I looked through the play-by-play data to compare the amount of offensive holding penalties called through two weeks of every season since 2009. The following chart shows the results:

Sure enough, this decree by the referees has led to an influx in offensive penalties through the first two weeks. After an emphasis on nerfing defense the past few seasons, defensive players and coaches must be letting out a collective sigh of relief. If the present rules are meant to favor the offensive side of the ball, the least the league can do is hold offenses accountable for blocking within the guidelines of the rule book. To take this one step forward, I looked at the number of holding calls by play type:

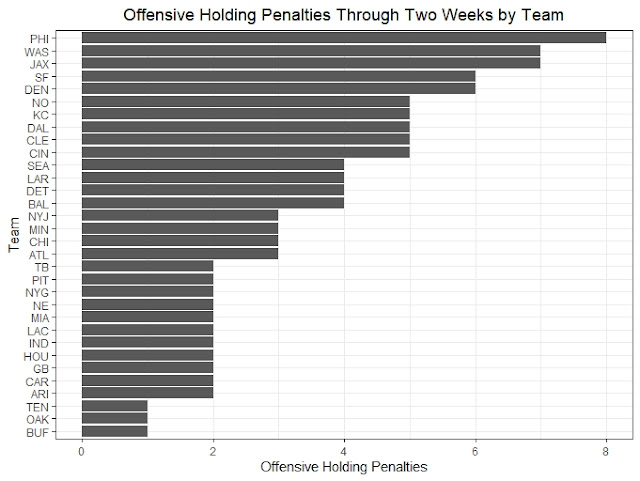
Another feather in the cap of passing truthers. Not only is passing more efficient but it also yields less offensive holding penalties. This should be noted by offensive play callers who insist on running the ball on early downs. Offensive penalties are extremely costly; they set an offensive back by 10 yards. Such a penalty can effectively kill a series. Finally, I took a look at the amount of offensive holding penalties by offense this year through the first two weeks (this does not include the Thursday night game between Tennessee and Jacksonville):

There does not seem to be much of a correlation between number of holding penalties and offensive efficiency thus far in the season, but note that two weeks worth of penalties is a tiny sample on the team level. Philadelphia, San Francisco, Dallas, and of course Kansas City are four of the most prolific offensive teams in the league and they find themselves at the top of this leader board. If they can clean up some of these mistakes, this can lead to even more successful series for those offenses. Furthermore, Oakland, Tennessee, Carolina, and Green Bay are all at the bottom and they have been woeful on offense thus far. These offenses do not have much work to do with regards to their discipline, however if they want to remain relevant for the rest of the season they need to look for improvements elsewhere.

Sunday, September 15, 2019

2019 Week 2 Changes In Play Script Signals

Following up from my previous post about play script signals, I wanted to show the changes from week 1 to week 2. The tip of the arrows in the plot below represent the pass rates for each team's first 15 plays and the tail represents the pass rate on the first 15 plays from week 1:


Baltimore against a more competitive team threw the ball at a more reasonable rate to start the game. Buffalo, after inexplicably throwing on its first 15 plays, regressed closer to the league average pass rate in its second game against the Giants.

The Giants, in that same game, lost some of the promising gains they made in their play script last week against Dallas. While the Giants have been very successful running the ball to start the year (to the tune of a success rate over 50%, tops in the league), it has not mattered because for much of the young season they have trailed by multiple scores. There have been calls for the Giants to give the ball more to star running back Saquon Barkley. Given the game scripts thus far, that would be a terrible idea. Running the ball when losing by multiple scores is not a +EV strategy no matter the success rate. If you run the ball well, you burn a lot of clock and when trailing by multiple scores time is of the essence.

The Bengals, despite a hobbled Joe Mixon, ran the ball much more to start the game. Last week I talked about how Green Bay's script ran counter to the off-season narrative of wanting the establish the run. This week aligned more with that story line. Of course, a quick lead made it so running the ball was more palatable, nevertheless its an interesting development to monitor next week. New England had no problem running the ball against the woeful Dolphins. Chicago was one the of run-heaviest teams to start its game against Denver despite the close spread, which would generally indicate we should expect a lot of neutral game scripts. This is a manifestation of Mitchell Trubisky's awful start to the season. After trading up to draft him over Pat Mahomes and Deshaun Watson, I am sure the Chicago brain-trust is not pleased feeling the need to open up a close game with a 40% pass rate.

Play Sequencing Results by Down

How NFL teams sequence plays is instrumental in their offensive success. Each play call in football is its own little game: the offense picks a play based on what it thinks the defense will do and what it thinks the defense will expect. The defense calls its play based on what it thinks the offense is most likely to do. A football game is not just one play, however, but a sequence of plays where the result of the previous play affects what the offense decides to call for the play at hand. Thus, I thought it would be a useful exercise to look at all of the two play sequences in the NFL since 2009 by down to see which sequences were most effective for the offense based both success rate and EPA per play (EPA stands for expected points added and is an estimate of the change of an offenses expected points for a given play from one play to the next).  Success rate is defined as the percentage of plays with a positive EPA.

I filtered out all sequences that happened on different drives because intuitively the last play on one drive should not have much of an effect on the first play of the current drive. I also only considered run and pass plays (i.e. no special teams) and filtered out garbage time (where the win probability at any point exceeded 85% or was less than 15% for the offense). Now, let us look at the data. Note, the first play listed is the play at hand while the second play is the play that preceded it (pass-run means a pass play preceded by a run play). The first chart shows the number of two play sequences for each of the four downs:


Now, let's look at the success rates of each play sequence by down:


Based on analysis done in the past, we should not be surprised that throwing the ball on first and second down, no matter the previous play call, is the most lucrative play calling strategy. Based on the disparity in success rates, however, teams are still using sequences with running plays far too often relative to passing plays. On later downs, we see that sequences involving rushes tend to be more successful. Again, we have seen the analysis that running the ball is effective when a team gets close to gaining a first down, and considering third and fourth downs often have shorter to-go distances, running the ball on those later downs should be more effective. This is especially true on fourth down, where if a team is running or throwing the ball in a non-garbage time situation, that team is probably close to the sticks. One more note about fourth downs is to focus in on the success rates of all four two play sequences. The success rates across the board are large relative to other downs which indicates that teams should be very aggressive with their play calling on fourth down. The only sequence with a success rate of less than 50% on fourth down is pass-pass, and if a team is passing on fourth down following a pass on third down, then that team is probably not especially close to the first down marker.  Still, on all rushes and passes in the NFL the last ten years, the league average success rate is about 44%, so no matter the play call on fourth down or the one preceding it, going for it yields a higher success rate than average.

Finally here is a similar plot to the one above, except this time with EPA per play instead of success rate:

This plot confirms our prior suspicions: Go for it on fourth down more and throw the ball on early downs. Looking at third downs, based on EPA per play, teams in general should be throwing the ball more. The success rates for running the ball on third down are a bit more robust than those for passing compared to the EPA per play results, but generally if a team is running the ball on third down, that team is close to the sticks. However if that run fails, considering you are close to a new first down, the expected points drop is rather large between a punt and a first down, assuming the next play is a punt. If is throwing on third down, it is likely third and long so the expected points on that drive is low to begin with and an in-completion will therefore have a low EPA. So on most third downs, all else being equal, throwing the ball is way more effective, which should not be a very controversial opinion.

data from 2009 season through week 1 of 2019 season

data via nflscrapr

Saturday, September 14, 2019

2019 Week 1 Play Script Signals

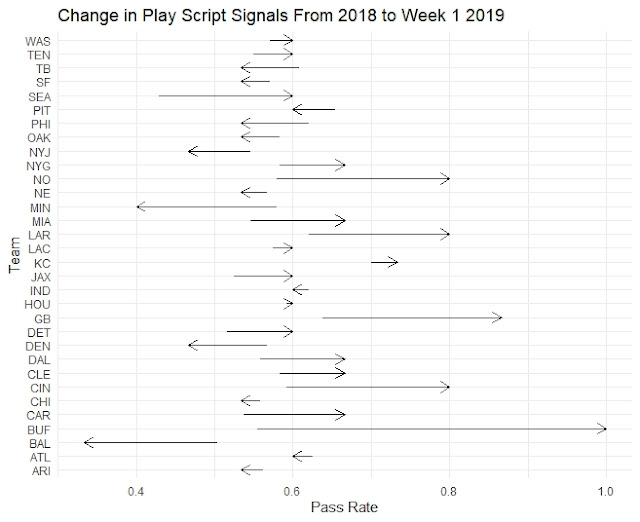
Generally in the NFL, a team has a script of plays they want to run to start the game. The run-pass tendencies can sometimes give us insights into how teams view the best way to mix running and passing the ball. Inspired by a viz from Kevin Cole of PFF after week 1 I looked at the pass rates for every teams' first 15 plays in 2019 and compared that rate to their pass rates from the first 15 plays during the 2018 season. The following plot shows those changes:


Looking at the plot, you can see that in week 1 the Bills had 15 straight dropbacks to start the game. We have heard that the Bills have been building out one of the larger analytics departments in the league and this seems to jibe with that notion. Green Bay, despite all of the talk of becoming more balanced this off-season, dropped back on 13 of its first 15 plays against Chicago. The Giants, surprisingly, were very aggressive throwing the ball to start the game against the Cowboys in week 1. Overall the Giants threw the ball a ton, only giving Barkley 11 carries in the game. This, of course, was dictated by the game scripts, but nevertheless this should be a mildly positive trend for the more analytically inclined Giants fans.

Minnesota coach Mike Zimmer,  like Green Bay, talked a lot about establishing the run this off-season. The Vikings play script signals suggest they are going to do just that. Baltimore barely dropped back to start the game against Miami despite the fact that the Ravens and Lamar Jackson eviscerated the Dolphins through the air. Finally, one more interesting trend in play calling was with the Jets. We heard that head coach Adam Gase was not too keen on the acquisition of Le'Veon Bell this off-season. Despite this sentiment, it does seem that they tried to give him the ball early.

Overall, most teams threw the ball more to start the game than they did in 2018. This is consistent with the overall trend of teams throwing the ball more as teams become more privy to the relative efficiency of a pass versus a run.

data via nflscrapr