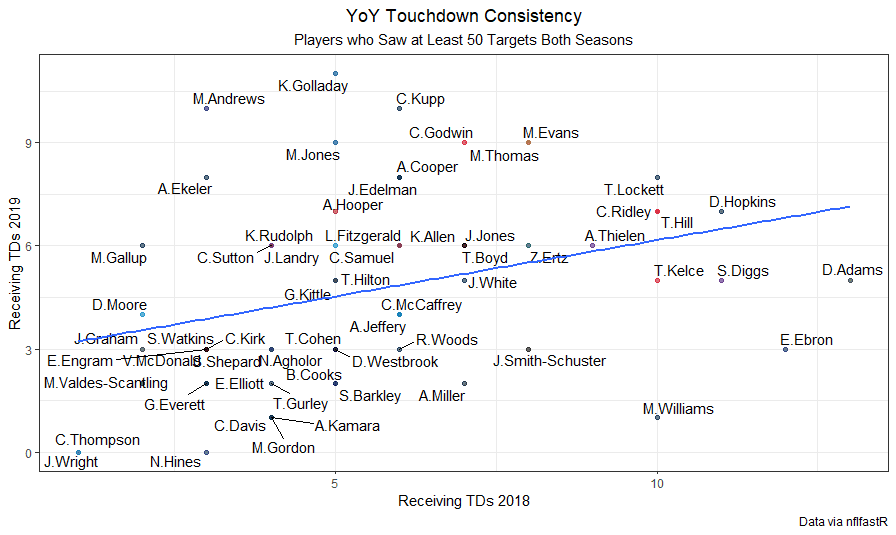
Over the course of an NFL regular season, the league runs somewhere between 30,000 and 35,000 offensive plays (not including special teams plays). From there you can extrapolate that an average team runs about 1,000 plays a season and most teams are within 100 plays of that figure. The average team scores about 40 offensive touchdowns in a season, 25 of which are threw the air. Consider how small a proportion of total passing attempts are touchdowns. The league average passing touchdown rate is about 4.5 percent, so those throws make up such a small subset of the teams actual play results. Even Patrick Mahomes in his otherworldly 2018 season (where he threw 50 touchdowns), only had a touchdown rate of 8.6 percent. The most prolific passing season in recent memory did not even have 10 percent of its passing plays result in touchdowns. There are two lessons to be learned here: be careful when evaluating quarterbacks based on touchdowns because you are throwing out most of the data you have on his season and touchdowns are subject to a ton of variance year over year because they make up such a small sample of plays. There is little signal to be found in touchdown rates in a single season. Consequently, pass catchers are subject to even more touchdown variance because they have an even smaller number of plays to analyze. Michael Thomas, the NFL's preeminent target hog going into 2020, only sees about 30 percent of his team's total passing attempts. So if a team throws 600 passes, a top receiver will only see 180 targets. And that is on the extreme end. Most top wideouts see target shares closer to 20 percent. So knock 60 targets off of 180 and we find that most top wideouts see around 120 targets in a single season, if he plays all 16 games. To put some perspective on this phenomenon, check out the year over year consistency of both total touchdowns and touchdown rate (percent of targets resulting in touchdowns) for receivers who saw middling to high volume in 2018 and 2019:


The correlation for total touchdowns is 0.111 (11.1 percent of the variance in touchdowns for 2018 explained variance in 2019) and for touchdown rate it was just 5.73 percent. Both are not strong, but why is total touchdowns a bit stickier? One might think that pass-catchers have more control over the rate at which they score touchdowns because it might isolate the skill of the receiver. However, due to the aforementioned issue of small samples even for the most high-volume players, the rates are incredibly noisy. Opportunity, in the form of target share, red zone target share, and share of team air yards, is more predictive year over year, thus total touchdowns see a slightly more consistency. There is some signal in team and quarterback intent. The fact that players earn more or less targets can tell us a lot about what the team or quarterback thinks of them. A player can earn a target through a coach scheming an easy throw or the quarterback can choose to throw the receiver the ball either because he has gained separation or he just trusts the receiver to make a contested. These "share" indicators implicitly give us more information when prognosticating touchdowns by measuring this intent. When looking at these measures year over year, I found they are much more consistent.


Of the three, red zone share had the worst correlation of 18.1 percent. For target share, it was a bit better at 27.8 percent. Air yards share was a robust 62.2 percent, a correlation figure that is very rare in the world of football analysis, which (as I have harped on in all my recent posts) is subject to small samples and a lot of noise. Even the worst of these stats is much stickier in year N+1, so when figuring out which pass-catchers are primed for some touchdown regression, I decided that these share stats would be useful tools. I also considered total team pass attempts because intuitively it is easier to accumulate touchdowns if your team throws more. I built a regression model with target, red zone, and air yards share in addition to team passing attempts to see which players under or over-performed based on their actual receiving touchdown total. The R-squared for the model was 0.433, an acceptable figure given the noisiness of touchdowns. The following compares the expected touchdown output of a player based on the model versus his actual production:

For this visualization I only included receivers who saw a lot of targets. Michael Thomas scored a number of touchdowns commensurate with his usage in the New Orleans offense. Among the most heavily targeted receivers, Kenny Golladay, DeVante Parker, and Cooper Kupp all out-performed their expected touchdowns based on opportunity. On the other end we find Courtland Sutton, Allen Robinson, Davante Adams, and Odell Beckham Jr. Given I had a sample of players you received at least 50 targets, I also created tables for the 15 largest over and under-performers:


I would note before pegging players to flame out or break-out in 2020, that this estimation of expected touchdowns and touchdowns over expected is based on opportunity. For example, players like Kenny Golladay and A.J. Brown, two of the best young receivers in the league, should be expected to regress if they see similar volume and opportunity. However, given where they are in their careers, they are two specific players who I think will see even targets come their way in 2020. Full seasons from Matt Stafford and Ryan Tannehill, along with their target shares creeping up into the 20 percent range, should stave off this oncoming regression. Players like Sutton and Beckham, who were among the unluckiest in the league, saw a ton of volume and will probably continue to see a ton of volume. These players, where you can project stable opportunity, are the types that you should look to have big break-outs or bounce-back seasons. Hopefully this study into touchdowns and opportunity helps you better understand what you see on Sundays and how we should contextualize receiver performance going forward.


No comments:
Post a Comment